Reporting and Analytics
The Call for Help Dashboard allows you to view and analyze the key metrics of your call buttons and displays to gain valuable insights into how your customers request help and how your staff respond to those requests.
Access the Dashboard
- Sign into MyStore as a Location Administrator
- Select Call for Help
- Select Dashboard
Overall Summary
The Overall Summary provides a snapshot of essential metrics related to your Call for Help operations:
- Total Number of instances: The total number of help requests.
- Total number of escalations: The total number of help requests that were escalated.
Generate a Report
- Within the Overall Summary box, locate the date selection boxes labeled "Start Date" and "End Date."
- Select the desired start date and end date to define the date range for your report. Ensure the date range does not exceed 31 days.
- Once you've selected the date range, the metrics will automatically update to reflect data specific to that range.
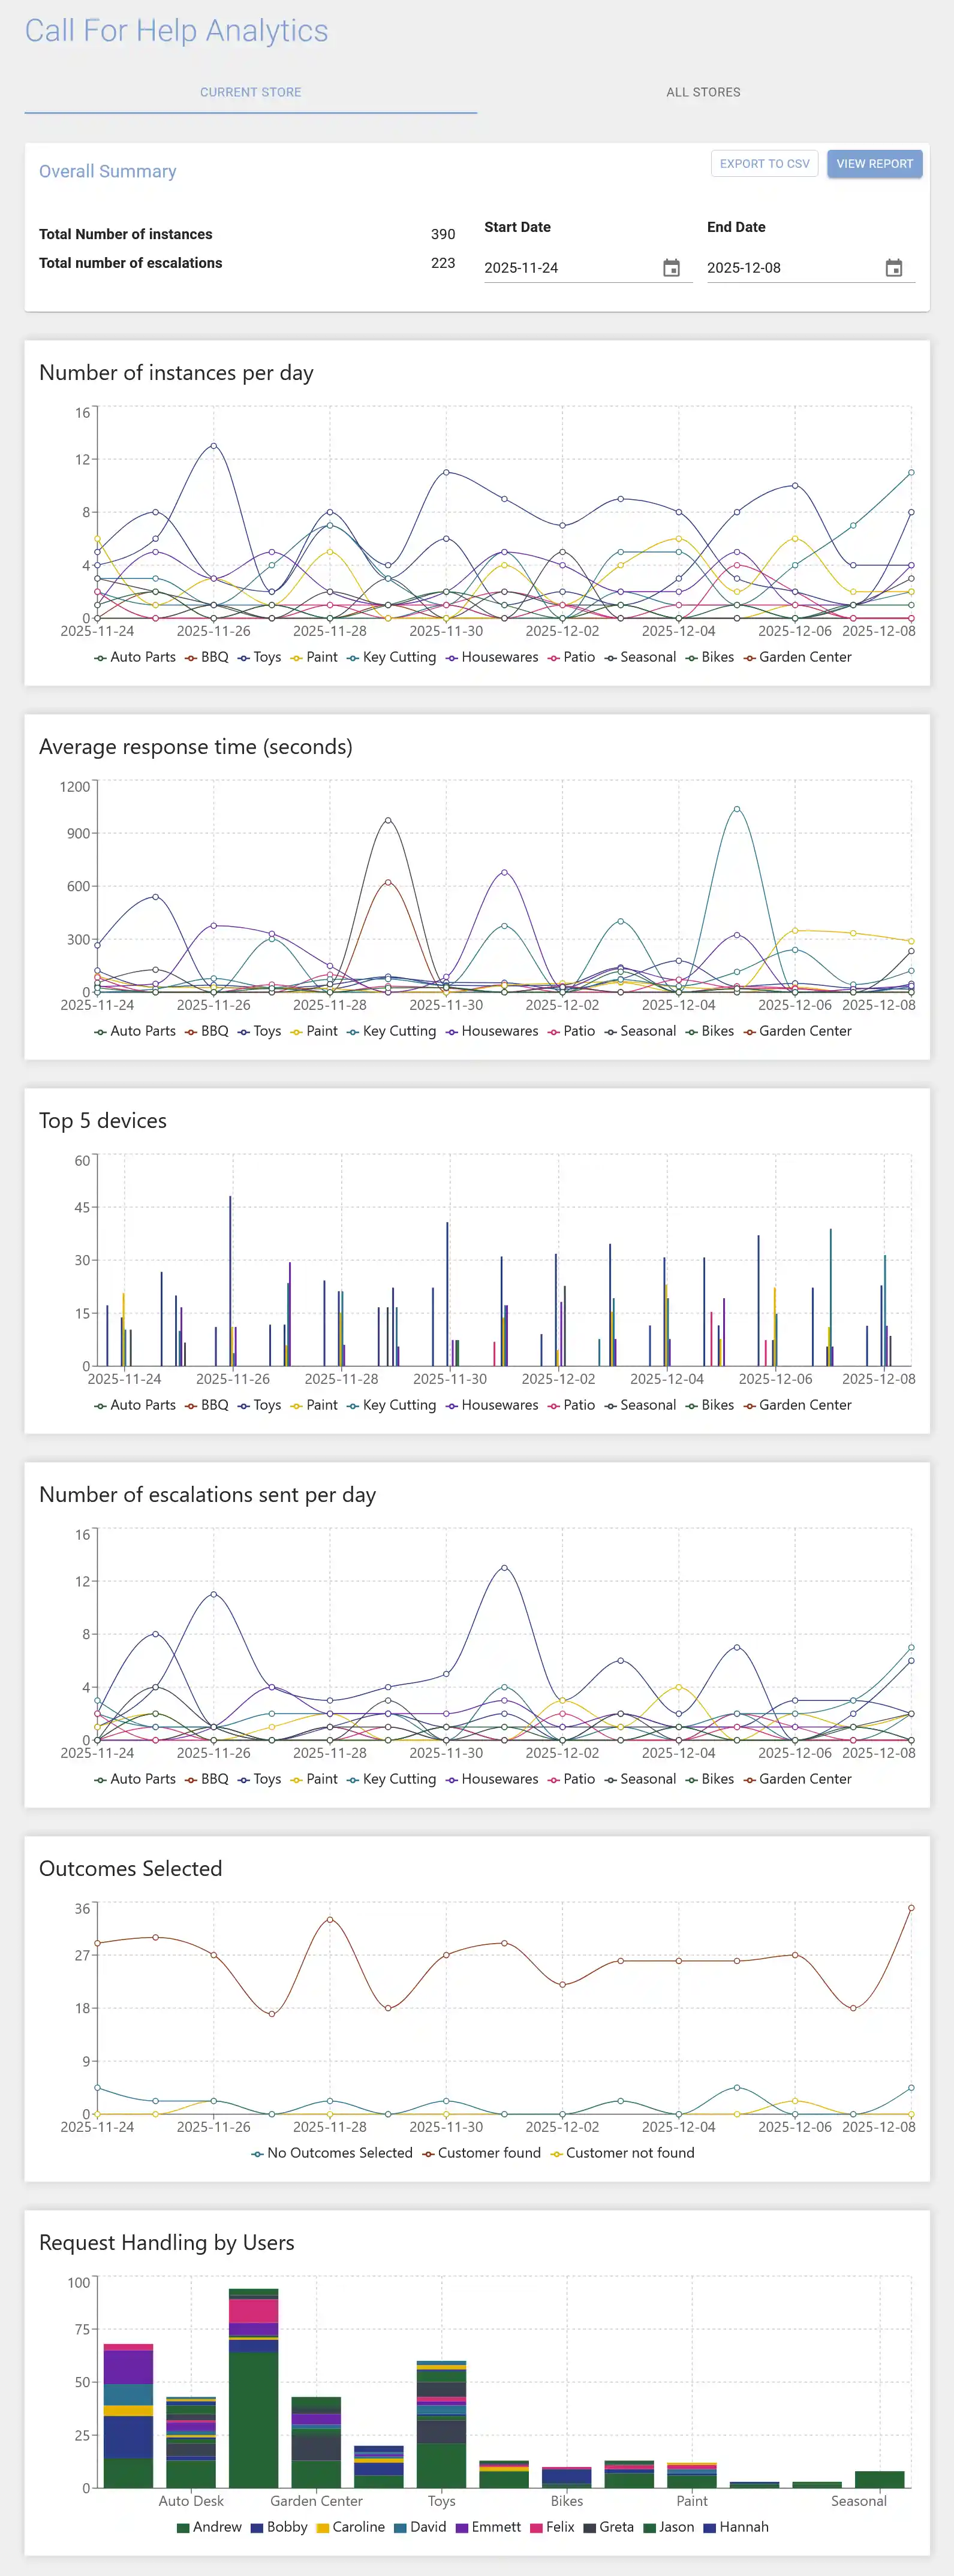
Interpret the Data
- Number of instances per day: Identify number of help requests each button receives.
- Average response time: How long does it take your staff to respond to each button.
- Top 5 devices: These are your most active buttons each day.
- Number of escalations sent per day: Identify which buttons have the most escalations.
- Outcomes Selected: Identify customer engagement and sales impact of help requests.
- Request Handling by Users: Identify which staff members respond to which help requests.
Example Report
Export Report Data
The raw data used in the report can be exported to CSV to use with other analytics tools.
To export the raw data click the EXPORT TO CSV button.